Submission statistic
Showing some particular statistic over user submission. The main aspects are an evolution in time and success rate. * number of submmission over time * succesful submission over time * leaderboard evolving - scores and ranking
The ANHIR challenge is hosted on https://anhir.grand-challenge.org.
These particular results are for ANHIR workshop hosted at ISBI 2019 in Venice, Italy. In case you want to get some further evaluation related to new submission, you may contact one of the ANHIR administrators because the full submission is required, see https://anhir.grand-challenge.org/Organizers.
[1]:
%matplotlib inline
%load_ext autoreload
%autoreload 2

import os, sys
import glob, json
import shutil

import tqdm
import pandas as pd
import numpy as np
import matplotlib.pyplot as plt
import seaborn as sns

sys.path += [os.path.abspath('.'), os.path.abspath('..')]  # Add path to root
from birl.utilities.data_io import update_path
from birl.utilities.drawing import draw_matrix_user_ranking
from birl.utilities.evaluate import grouping_cumulative, aggregate_user_score_timeline
Loading submission table
The required input table is exported from https://anhir.grand-challenge.org/evaluation/jobs/ which is accessible for ANHIR administrators.
[2]:
# temporary folder for figures submissions
PATH_TEMP = os.path.abspath(os.path.expanduser('~/Desktop/ANHIR_submissions'))
PATH_SUBMISSIONS = os.path.join(update_path('bm_ANHIR'), 'submissions.csv')
df = pd.read_csv(PATH_SUBMISSIONS)
# conver the data-time columns
for col in ['Created', 'Updated']:
    df[col] = pd.to_datetime(df[col])
df['Team'] = df['User'].apply(lambda txt: txt[txt.index(' (') + 2: txt.index(')')]
                                          if all(c in txt for c in '()') else None)
df['User'] = df['User'].apply(lambda txt: txt[:txt.index(' (')] if all(c in txt for c in '()') else txt)
# compute time remaining to deadline
df['Till_Deadline'] = - df['Created'].sub(pd.to_datetime('April 1, 2019, 9:00 a.m.'), axis=0)
df['Deadline_days'] = (df['Till_Deadline'] / np.timedelta64(1, 'D')).astype(int)
print ('loaded records: %i' % len(df))
df.head(3)
loaded records: 279
[2]:
| ID | Created | Updated | User | Status | Position | Comment | Hide/Publish | Team | Till_Deadline | Deadline_days | |
|---|---|---|---|---|---|---|---|---|---|---|---|
| 0 | 104f40bb-7e23-484d-8383-4a476bff5684 | 2019-04-01 04:24:00 | 2019-04-01 04:26:00 | Mohammed | Succeeded | 9.0 | NaN | NaN | NMPN | 04:36:00 | 0 |
| 1 | 6c82a929-2073-4c4f-964c-8c03ff1aecb0 | 2019-04-01 04:18:00 | 2019-04-01 04:19:00 | Mohammed | Succeeded | NaN | NaN | NaN | NMPN | 04:42:00 | 0 |
| 2 | 0eaa70e6-0be9-44aa-843c-02cba8b4cae9 | 2019-04-01 03:59:00 | 2019-04-01 04:00:00 | Mohammed | Succeeded | NaN | NaN | NaN | NMPN | 05:01:00 | 0 |
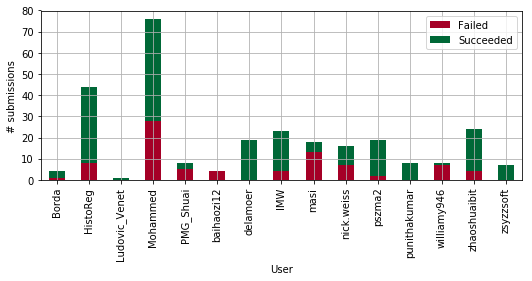
Visualise participants info
Showing charts related to individual participants
[3]:
dfx = grouping_cumulative(df, col_index='User', col_column='Status')
ax = dfx.plot(kind='bar', stacked=True, figsize=(len(dfx) / 2, 4), grid=True, cmap='RdYlGn')
_= plt.ylabel('# submissions')
ax.get_figure().tight_layout()
ax.get_figure().savefig(os.path.join(PATH_TEMP, 'plot_team-submit-succes.pdf'))
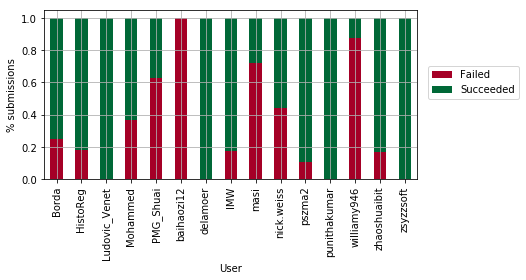
# normalize over the sum of all cases
dfx = (dfx.T / dfx.T.sum().astype(float)).T
ax = dfx.plot(kind='bar', stacked=True, figsize=(len(dfx) / 2, 4), grid=True, cmap='RdYlGn')
ax.legend(loc='upper center', bbox_to_anchor=(1.15, 0.7), ncol=1)
_= plt.ylabel('% submissions')
ax.get_figure().tight_layout()
ax.get_figure().savefig(os.path.join(PATH_TEMP, 'bar_team-submit-succes.pdf'))
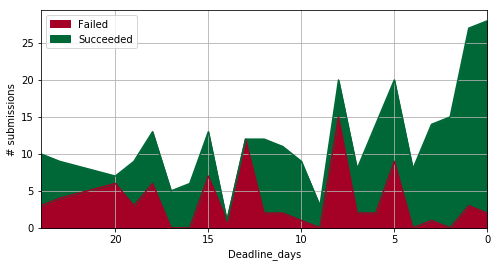
[4]:
dfx = grouping_cumulative(df, col_index='Deadline_days', col_column='Status')
_= dfx.plot(kind='area', cmap='RdYlGn', figsize=(len(dfx) / 3, 4), grid=True)
_= plt.xlim([len(dfx), 0]), plt.ylabel('# submissions')
ax.get_figure().tight_layout()
ax.get_figure().savefig(os.path.join(PATH_TEMP, 'plot_time-submit-succes.pdf'))
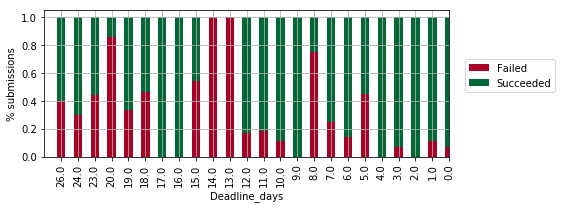
# normalize over the sum of all cases
dfx = (dfx.T / dfx.T.sum().astype(float)).T
ax = dfx.plot(kind='bar', stacked=True, cmap='RdYlGn', figsize=(len(dfx) / 3, 3), grid=True)
ax.legend(loc='upper center', bbox_to_anchor=(1.15, 0.7), ncol=1)
_= plt.xlim([len(dfx), 0]), plt.ylabel('% submissions')
ax.get_figure().tight_layout()
ax.get_figure().savefig(os.path.join(PATH_TEMP, 'bar_time-submit-succes.pdf'))
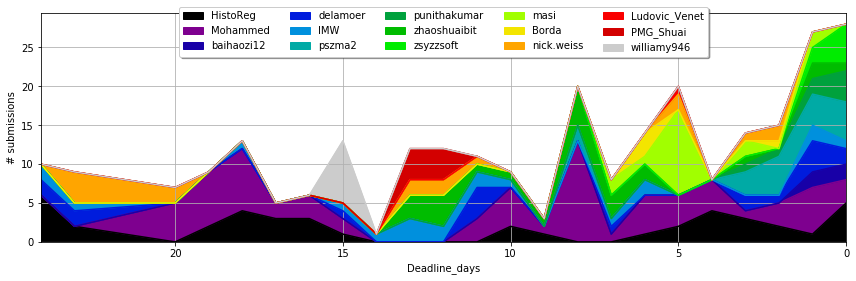
Visualise submissions info
Showing charts related to particular submissions
[5]:
dfx = grouping_cumulative(df, col_index='Deadline_days', col_column='User')
ax = dfx.plot(kind='area', cmap='nipy_spectral', figsize=(len(dfx) / 2, 4), grid=True)
_= plt.legend(loc='upper center', bbox_to_anchor=(0.5, 1.05), ncol=int(np.ceil(len(dfx.columns) / 3)), fancybox=True, shadow=True)
_= plt.xlim([len(dfx), 0]), plt.ylabel('# submissions')
ax.get_figure().tight_layout()
ax.get_figure().savefig(os.path.join(PATH_TEMP, 'plot_time-submit-team.pdf'))
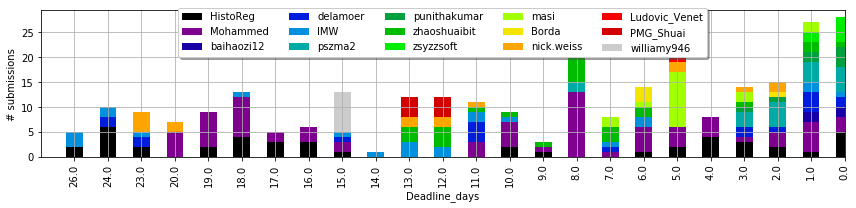
ax = dfx.plot(kind='bar', stacked=True, cmap='nipy_spectral', figsize=(len(dfx) / 2, 3), grid=True)
_= plt.legend(loc='upper center', bbox_to_anchor=(0.5, 1.05), ncol=int(np.ceil(len(dfx.columns) / 3)), fancybox=True, shadow=True)
_= plt.xlim([len(dfx), 0]), plt.ylabel('# submissions')
ax.get_figure().tight_layout()
ax.get_figure().savefig(os.path.join(PATH_TEMP, 'bar_time-submit-team.pdf'))
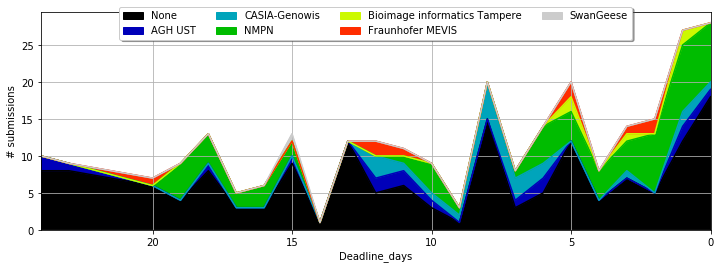
[6]:
dfx = grouping_cumulative(df, col_index='Deadline_days', col_column='Team')
_= dfx.plot(kind='area', cmap='nipy_spectral', figsize=(len(dfx) / 2, 4), grid=True)
_= plt.legend(loc='upper center', bbox_to_anchor=(0.5, 1.05), ncol=int(np.ceil(len(dfx.columns) / 2)), fancybox=True, shadow=True)
_= plt.xlim([len(dfx), 0]), plt.ylabel('# submissions')
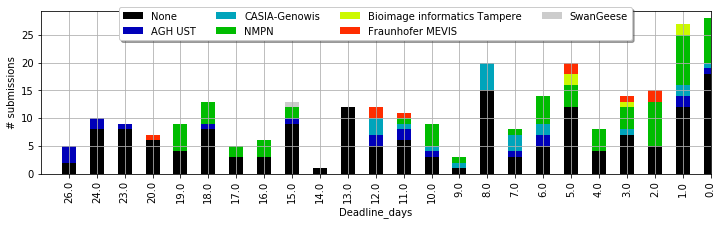
_= dfx.plot(kind='bar', stacked=True, cmap='nipy_spectral', figsize=(len(dfx) / 2, 3), grid=True)
_= plt.legend(loc='upper center', bbox_to_anchor=(0.5, 1.05), ncol=int(np.ceil(len(dfx.columns) / 2)), fancybox=True, shadow=True)
_= plt.xlim([len(dfx), 0]), plt.ylabel('# submissions')
Leader-board evolving
Evolving of the automatic leader board over time with respect to a particular score. Exporting on rob results of a particular evalation method is required, see for example https://anhir.grand-challenge.org/evaluation/methods/80cebd88-9133-4802-98cf-53d878e1bb30/ (to do so you have to be challnge admin)
[7]:
import yaml # https://stackoverflow.com/questions/988228

PATH_SUBMISSIONS = os.path.join(update_path('bm_ANHIR'), 'submission-results.csv')
df_res = pd.read_csv(PATH_SUBMISSIONS)
print ('loaded records: %i' % len(df_res))
df_res.head(3)
loaded records: 183
[7]:
| Created | Updated | Job | Submission | Status | Result | |
|---|---|---|---|---|---|---|
| 0 | March 19, 2019, 12:02 p.m. | March 19, 2019, 12:04 p.m. | 16ab9924-1d33-4a1e-84d7-6e55c6f201b6 | e0845c22-8030-4227-a3ca-c5047d380eae | Succeeded | {'cases': 'not exported', 'computer': {'file':... |
| 1 | March 19, 2019, 12:23 p.m. | March 19, 2019, 12:25 p.m. | 9cc3dd8f-5331-4748-841b-76db1fdd2534 | f4e4453b-7b35-47e2-822a-adf04d2de0ae | Succeeded | {'cases': 'not exported', 'computer': {'file':... |
| 2 | March 19, 2019, 1 p.m. | March 19, 2019, 1:03 p.m. | a2325f59-0561-4883-bf89-08b2d15ed444 | 57d86dc8-bcfd-4661-abca-42ac5f71bf9a | Succeeded | {'cases': 'not exported', 'computer': {'file':... |
Merge results with user submissions
[8]:
df2 = df.merge(df_res[['Job', 'Submission', 'Result']], how='right', left_on='ID', right_on='Job')
print ('loaded records: %i' % len(df2))
# get aggregated results
result_str = df2.iloc[0]['Result']
# parse keys from aggregated results
agg_cols = list(yaml.load(result_str)['aggregates'].keys())
# convert aggregated resulst to table columns
for col in agg_cols:
    df2[col] = df2['Result'].apply(lambda ar: yaml.load(ar)['aggregates'][col]
                                   if isinstance(ar, str) else None)
df2 = df2[['Created', 'User', 'Team', 'Till_Deadline', 'Deadline_days'] + agg_cols]
df2.head(3)
loaded records: 183
/home/jb/.local/lib/python3.6/site-packages/ipykernel_launcher.py:6: YAMLLoadWarning: calling yaml.load() without Loader=... is deprecated, as the default Loader is unsafe. Please read https://msg.pyyaml.org/load for full details.

/home/jb/.local/lib/python3.6/site-packages/ipykernel_launcher.py:10: YAMLLoadWarning: calling yaml.load() without Loader=... is deprecated, as the default Loader is unsafe. Please read https://msg.pyyaml.org/load for full details.
  # Remove the CWD from sys.path while we load stuff.
[8]:
| Created | User | Team | Till_Deadline | Deadline_days | Average-Max-rTRE | Average-Norm-Time | Average-Robustness | Average-Median-rTRE | Average-Rank-Max-rTRE | Average-used-landmarks | Average-Max-rTRE-Robust | Average-Norm-Time-Robust | Average-Rank-Median-rTRE | Average-Median-rTRE-Robust | |
|---|---|---|---|---|---|---|---|---|---|---|---|---|---|---|---|
| 0 | 2019-04-01 04:24:00 | Mohammed | NMPN | 04:36:00 | 0 | 0.0750648 | 2.540539 | 0.959315 | 0.021120 | None | 1.029598 | 0.062872 | 2.549469 | None | 0.014818 |
| 1 | 2019-04-01 04:18:00 | Mohammed | NMPN | 04:42:00 | 0 | 0.0756789 | 2.487868 | 0.955414 | 0.021160 | None | 1.029467 | 0.062904 | 2.499697 | None | 0.014807 |
| 2 | 2019-04-01 03:59:00 | Mohammed | NMPN | 05:01:00 | 0 | 0.0774333 | 2.521503 | 0.951477 | 0.023891 | None | 1.029401 | 0.063235 | 2.539681 | None | 0.016295 |
Visualisations
Showing the evolving over time from perspective of the score and mean-time ranking
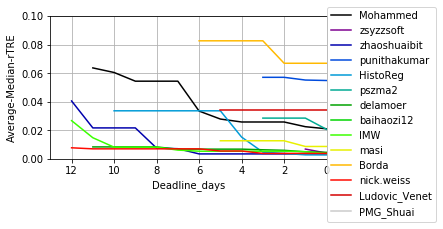
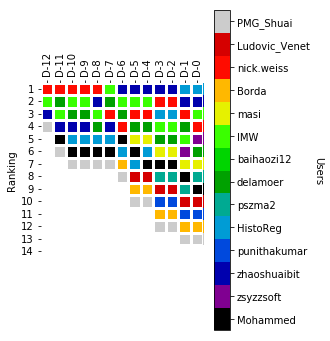
Timeline: Average Median rTRE
[9]:
dfx = aggregate_user_score_timeline(df2, 'Deadline_days', 'User', 'Average-Median-rTRE',
                                    lower_better=True, top_down=False, interp=True)
ax = dfx.plot(style='-', cmap='nipy_spectral', figsize=(len(dfx) / 2, 3), grid=True)
_= plt.legend(loc='upper center', bbox_to_anchor=(1.2, 1.1), ncol=1)
_= plt.xlim([len(dfx), 0]), plt.ylim([0, 0.1]),
_= plt.ylabel('Average-Median-rTRE'), plt.xlabel('Deadline_days')
ax.get_figure().tight_layout()
ax.get_figure().savefig(os.path.join(PATH_TEMP, 'plot_time-score_avg-median-rTRE.pdf'))

dfx.index = ['D-%i' % c for c in dfx.index]
fig = draw_matrix_user_ranking(dfx.T[dfx.index[::-1]])
fig.savefig(os.path.join(PATH_TEMP, 'chess_time-ranking_avg-median-rTRE.pdf'))
/home/jb/Dropbox/Workspace/BIRL/birl/utilities/evaluate.py:301: RuntimeWarning: All-NaN axis encountered
  mtx[aggrs.index(agg), users.index(usr)] = fn_best(dfgg[col_score])
/home/jb/Dropbox/Workspace/BIRL/birl/utilities/evaluate.py:309: RuntimeWarning: All-NaN slice encountered
  mtx[i, j] = fn_best(vals)
/home/jb/Dropbox/Workspace/BIRL/birl/utilities/evaluate.py:223: FutureWarning: Method .as_matrix will be removed in a future version. Use .values instead.
  ranking = np.zeros(df_stat.as_matrix().shape)
/home/jb/Dropbox/Workspace/BIRL/birl/utilities/visualisation.py:454: FutureWarning: Method .as_matrix will be removed in a future version. Use .values instead.
  fig, _ = plt.subplots(figsize=np.array(df_stat.as_matrix().shape[::-1]) * 0.35)
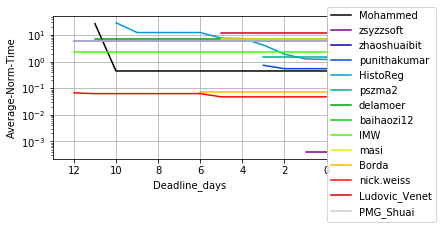
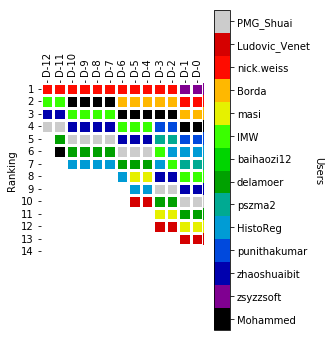
Timeline: Execution time
[10]:
dfx = aggregate_user_score_timeline(df2, 'Deadline_days', 'User', 'Average-Norm-Time',
                                    lower_better=True, top_down=False, interp=True)
ax = dfx.plot(style='-', cmap='nipy_spectral', figsize=(len(dfx) / 2, 3), grid=True)
_= plt.legend(loc='upper center', bbox_to_anchor=(1.2, 1.1), ncol=1)
_= plt.xlim([len(dfx), 0]), plt.yscale('log')
_= plt.ylabel('Average-Norm-Time'), plt.xlabel('Deadline_days')
ax.get_figure().tight_layout()
ax.get_figure().savefig(os.path.join(PATH_TEMP, 'plot_time-score_avg-time.pdf'))

dfx.index = ['D-%i' % c for c in dfx.index]
fig = draw_matrix_user_ranking(dfx.T[dfx.index[::-1]])
fig.savefig(os.path.join(PATH_TEMP, 'chess_time-ranking_avg-time.pdf'))
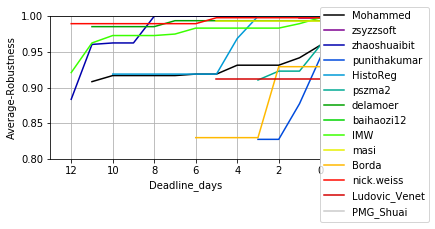
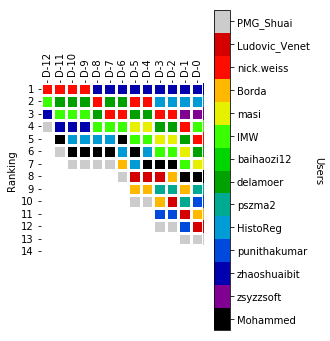
Timeline: Robustness
[11]:
dfx = aggregate_user_score_timeline(df2, 'Deadline_days', 'User', 'Average-Robustness',
                                    lower_better=False, top_down=False, interp=True)
ax = dfx.plot(style='-', cmap='nipy_spectral', figsize=(len(dfx) / 2, 3), grid=True)
_= plt.legend(loc='upper center', bbox_to_anchor=(1.2, 1.1), ncol=1)
_= plt.xlim([len(dfx), 0]), plt.ylim([0.8, 1.0]),
_= plt.ylabel('Average-Robustness'), plt.xlabel('Deadline_days')
ax.get_figure().tight_layout()
ax.get_figure().savefig(os.path.join(PATH_TEMP, 'plot_time-score_avg-robust.pdf'))

dfx.index = ['D-%i' % c for c in dfx.index]
fig = draw_matrix_user_ranking(dfx.T[dfx.index[::-1]], higher_better=True)
fig.savefig(os.path.join(PATH_TEMP, 'chess_time-ranking_avg-robust.pdf'))
[ ]: