Comparing SOTA results on CIMA over several scopes
This notebook serves as visualisation for State-of-the-Art methods on CIMA dataset
Note: In case you want to get some further evaluation related to new submission, you may contact JB.
[1]:
%matplotlib inline
%load_ext autoreload
%autoreload 2

import os, sys
import glob, json

import tqdm
import pandas as pd
import numpy as np
import matplotlib.pyplot as plt
import seaborn as sns

sys.path += [os.path.abspath('.'), os.path.abspath('..')]  # Add path to root
from birl.utilities.data_io import update_path
from birl.utilities.evaluate import compute_ranking
from birl.utilities.drawing import RadarChart, draw_scatter_double_scale
from bm_ANHIR.generate_regist_pairs import VAL_STATUS_TRAIN, VAL_STATUS_TEST
from bm_ANHIR.evaluate_submission import COL_TISSUE
/home/jb/.local/lib/python3.6/site-packages/dask/config.py:161: YAMLLoadWarning: calling yaml.load() without Loader=... is deprecated, as the default Loader is unsafe. Please read https://msg.pyyaml.org/load for full details.
  data = yaml.load(f.read()) or {}
This notebook serves for computing extended statistics and visualie some more statistics.
You can run the notebook to see result on both scales 10k and full both has to be extracted in bm_CIMA folder defined as PATH_RESULTS bellow.
[2]:
# folder with all participants submissions
PATH_RESULTS = update_path('bm_CIMA')
# temporary folder for unzipping submissions
PATH_TEMP = os.path.abspath(os.path.expanduser('~/Desktop/CIMA_compare'))
FIELD_TISSUE = 'type-tissue'

# configuration for Pandas tables
pd.set_option("display.max_columns", 25)
Some initial replacement and name adjustments
[3]:
# simplify the metrics names according paper
METRIC_LUT = {'Average-': 'A', 'Rank-': 'R', 'Median-': 'M', 'Max-': 'S'}

def col_metric_rename(col):
    for m in METRIC_LUT:
        col = col.replace(m, METRIC_LUT[m])
    return col
Load parsed measures from each experiment
[4]:
submission_dirs = sorted([p for p in glob.glob(os.path.join(PATH_RESULTS, '*')) if os.path.isdir(p)])
scope_user_cases = {}

for sdir in submission_dirs:
    submission_paths = sorted(glob.glob(os.path.join(sdir, '*.json')))
    submissions = {}
    # loading all participants metrics
    for path_sub in submission_paths:
        with open(path_sub, 'r') as fp:
            metrics = json.load(fp)
        # rename tissue types accoding new LUT
        for case in metrics['cases']:
            metrics['cases'][case][FIELD_TISSUE] = metrics['cases'][case][FIELD_TISSUE]
        submissions[os.path.splitext(os.path.basename(path_sub))[0]] = metrics

    users = list(submissions.keys())
    name = os.path.basename(sdir)
    print ('Users (%s): %r' % (name, users))
    user_cases = {u: submissions[u]['cases'] for u in users}
    scope_user_cases[name] = user_cases
Users (size-10k): ['ANTs', 'DROP', 'Elastix', 'RNiftyReg', 'RVSS', 'bUnwarpJ-SIFT', 'bUnwarpJ']
Users (size-full): ['ANTs', 'DROP', 'Elastix', 'RNiftyReg', 'RVSS', 'bUnwarpJ-SIFT', 'bUnwarpJ']
Transform the case format data to be simple form with extra colums for used and case ID to be able to draw a violine plot later.
[5]:
dfs_ = []
for scope in scope_user_cases:
    for usr in users:
        df = pd.DataFrame(scope_user_cases[scope][usr]).T
        df['case'] = df.index
        df['scope'] = scope
        df['method'] = usr
        dfs_.append(df)
df_cases = pd.concat(dfs_).reset_index()
del dfs_

for col in df_cases.columns:
    try:
        df_cases[col] = pd.to_numeric(df_cases[col])
    except Exception:
        print('skip not numerical column: "%s"' % col)
# df_cases.head()
skip not numerical column: "name-tissue"
skip not numerical column: "type-tissue"
skip not numerical column: "name-reference"
skip not numerical column: "name-source"
skip not numerical column: "scope"
skip not numerical column: "method"
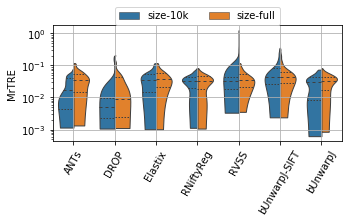
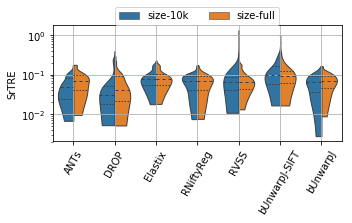
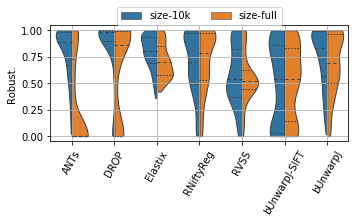
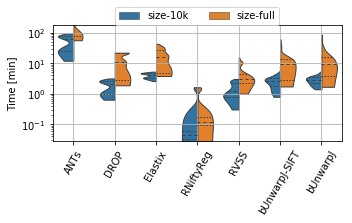
Showing violine plots on scope comaprison
[6]:
def _format_ax(ax, name, use_log=False, vmax=None):
    plt.xticks(rotation=60)
    if use_log:
        ax.set_yscale('log')
    if vmax:
        ax.set_ylim([0, vmax])
    ax.grid(True)
    ax.set_xlabel('')
    ax.set_ylabel(name)
    ax.get_figure().tight_layout()
[7]:
for field, name, log, vmax, bw in [('rTRE-Median', 'MrTRE', True, None, 0.01),
                                   ('rTRE-Max', 'SrTRE', True, None, 0.01),
                                   ('Robustness', 'Robust.', False, None, 0.05),
                                   ('Norm-Time_minutes', 'Time [min]', True, 180, 0.1)]:
    fig = plt.figure(figsize=(5, 3))
    # clr = sns.palplot(sns.color_palette(tuple(list_methods_colors(df_.columns))))
    sns.violinplot(ax=plt.gca(), data=df_cases, inner="quartile", trim=True, cut=0., linewidth=1.,
                   x="method", y=field, hue="scope", split=True, scale="width", width=0.75)
    _format_ax(fig.gca(), name, log, vmax)
    fig.gca().grid(True)
    lgd = fig.gca().legend(loc='upper center', bbox_to_anchor=(0.5, 1.2), ncol=2)
    fig.savefig(os.path.join(PATH_TEMP, 'violin_teams-scores_%s_mixed.pdf' % field),
                bbox_extra_artists=(lgd,), bbox_inches='tight')
/home/jb/.local/lib/python3.6/site-packages/matplotlib/axes/_base.py:3477: UserWarning: Attempted to set non-positive ylimits for log-scale axis; invalid limits will be ignored.
  'Attempted to set non-positive ylimits for log-scale axis; '
[ ]: